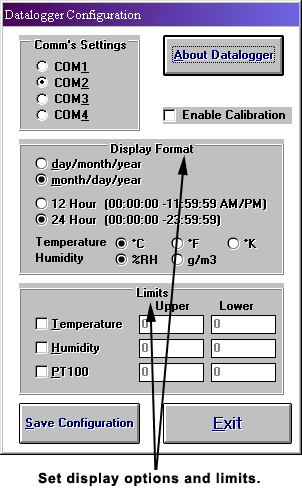
We present selected TruTrack software screenshots
Visualize your measurement session with
an auto-scaling time history graph.
(Click on this image to enlarge it)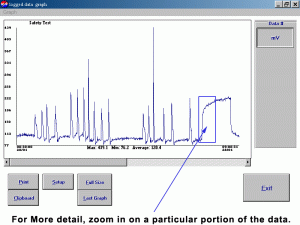
Time history graph detail screen
(Click on this image to enlarge it)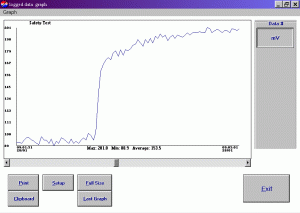
Look at every single data point.
(Click on this image to enlarge it)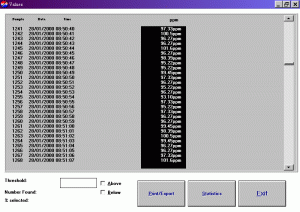
Target a threshold value, and determine the number of samples above and below this point. This calculates the following for all samples:
- Minimum
- Maximum
- Mean
And, for threshold studies, these are calculated:
- Samples above limit
- Samples below limit
- Time above limit
- Time below limit
- Samples outside limits
- Time outside limits
The TruTrack’s data files can be exported…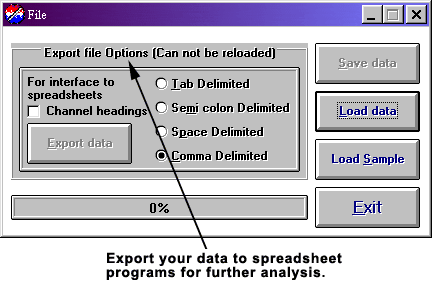
Hardware configuration, limits, and display preferences can easily be set…